Read reports and check unexpected figures
Choose the correct report and period, then trace an unexpected figure to the relevant conversations or records.
- Who uses it
- Administrators
- Content updated
- 2026-09-09
Sign in to your company workspace first. Add the /app/… paths below to your company system URL.
Before you start
- Access to Data analytics or the CEO cockpit; the selected data source must be connected and available.
Steps
Choose the report for the question
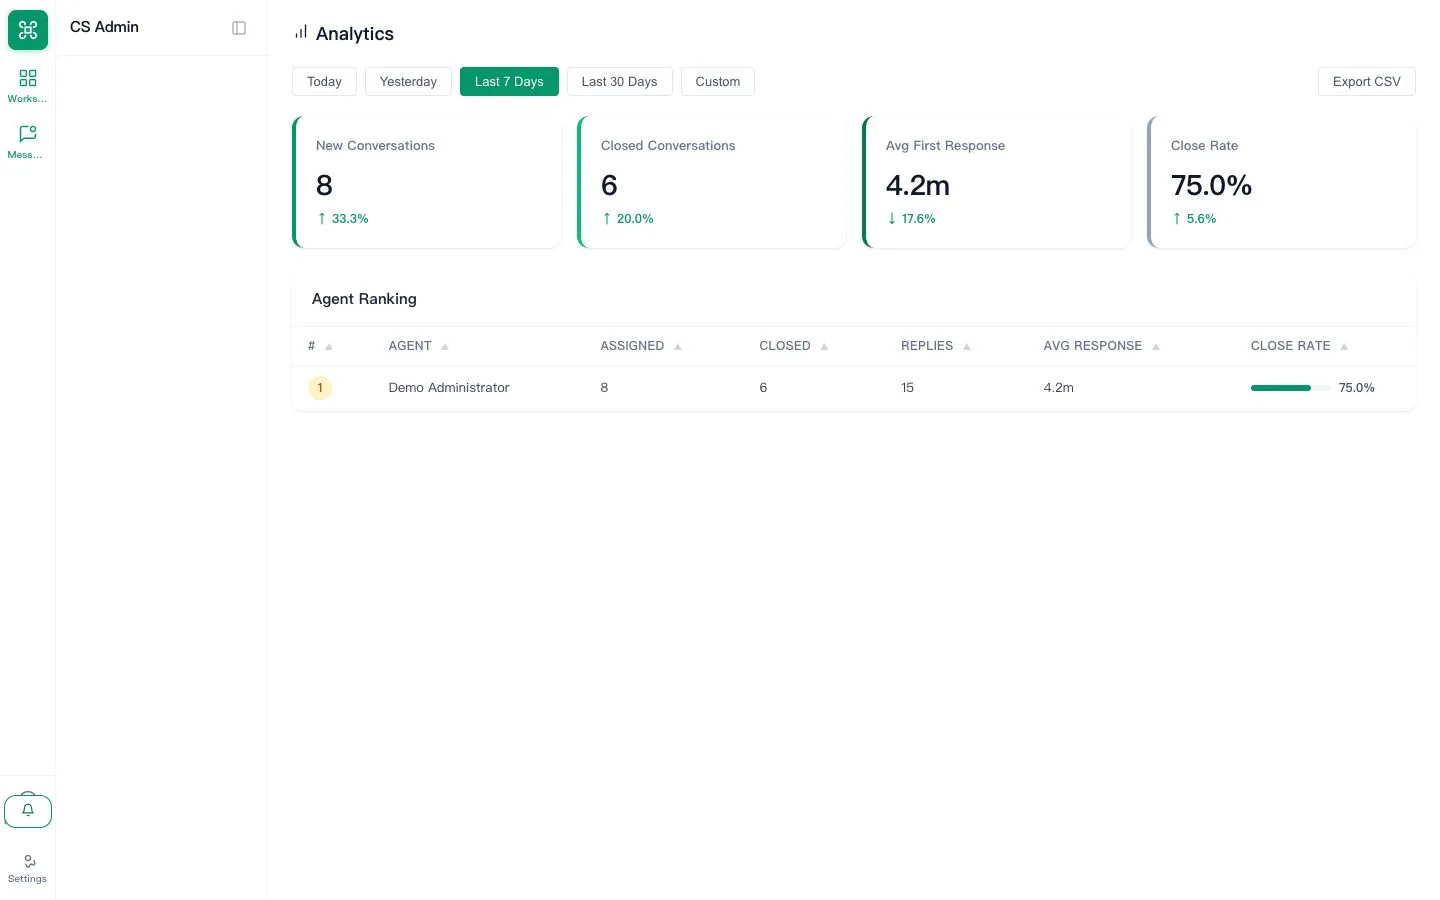
For customer-service activity, open Customer service → Reports → Data analytics at /app/analytics. For operating metrics, use the separately enabled CEO cockpit at /app/ceo. They are different pages and do not necessarily use identical measures.
Expected result: The report matches the work you want to understand.
Select the period
Data analytics offers Today, Yesterday, Last 7 days, Last 30 days and Custom. Choose Custom to enter a start and end date. Keep the same period and filters when comparing reports, and confirm the company timezone when dates differ.
Expected result: The selected period is clear before you interpret the numbers.
Read the measure and its scope
Review new and resolved conversations, response measures and agent ranking in Data analytics. In the CEO cockpit, check the metric’s own definition and source information. A missing or unavailable source is not a confirmed zero.
Expected result: You can name the measure, period and source behind the number.
Verify an unexpected number
Use the same period to check the source conversation, customer or order record. Note the filters and actual result before contacting support. Refreshing a report does not repair an unconnected external data source.
Expected result: The discrepancy is tied to a specific record or a clearly identified data gap.